Perl スクリプトで遅い場所を特定する方法 - Devel::Profiler / Devel::NYTProf
今仕事で書いてる Sledge アプリがあるのですが、先日負荷テストを行った結果びっくりすることに現行アプリの10倍遅いことが判明してしまいました・・・orz
Sledge フレームワーク自身が重くないことは今までの経験でわかってるのですが、どうにもソースを見直しているだけでは原因が特定できない・・・そんな活躍するのがプロファイラです。プロファイラの御陰で遅いヶ所を特定することができ、無事に想定するパフォーマンスを得ることができました。この内容に関してはまた別エントリにて。
さて、プロファイラを使うとプログラム実行時の各種情報を収集し、性能解析を行うことが可能です。プロファイラについてもう少し詳しくしるには 性能解析 - Wikipedia あたりを読むと良いでしょう。
プロファイルは統計的な総和としてソースコードの位置と関連付けてイベントを記録するため、データのサイズは対象となったコードのサイズにほぼ比例する。一方、トレースのサイズはプログラムの実行時間に比例したサイズとなってしまうため、実用的でないこともある。
さて、前置きはそんな程度にしておいて Perl においてのプロファイラをまとめてみました。
性能劣化ヶ所を特定するための Perl プロファイラまとめ
- Devel::DProf - http://search.cpan.org/~ilyaz/DProf-19990108/DProf.pm
-
昔から使われているプロファイラ。サブルーチン単位で処理時間を計測してくれる。
The Devel::DProf package is a Perl code profiler. This will collect information on the execution time of a Perl script and of the subs in that script. This information can be used to determine which subroutines are using the most time and which subroutines are being called most often. This information can also be used to create an execution graph of the script, showing subroutine relationships.
- Devel::Profiler - http://search.cpan.org/~samtregar/Devel-Profiler-0.04/lib/Devel/Profiler.pm
-
Devel::DProf からの乗り換えを想定して作られたヤツ。こちらの方が解析情報がわかりやすい。同じくサブルーチン単位で処理時間を計測してくれる。
This module implements a Perl profiler that outputs profiling data in a format compatible with dprofpp, Devel::DProf's profile analysis tool. It is meant to be a drop-in replacement for Devel::DProf.
- Devel::SmallProf - http://search.cpan.org/~salva/Devel-SmallProf-2.02/lib/Devel/SmallProf.pm
-
コードの各ライン毎の処理時間を計測してくれるヤツ。正直粒度が細かすぎて実行時間が 0.0000 みたいなのばっかりで解析しづらい。
The Devel::SmallProf profiler is focused on the time taken for a program run on a line-by-line basis. It is intended to be as "small" in terms of impact on the speed and memory usage of the profiled program as possible and also in terms of being simple to use.
- Devel::FastProf - http://search.cpan.org/~salva/Devel-FastProf-0.08/lib/Devel/FastProf.pm
-
こちらは Devel::SmallProf からの乗り換え向け。初めて知りました。Devel::SmallProf が遅いので代わりになる高速なヤツを作ったとのことです。
Devel::FastProf tells you how much time has been spent on every line of your program. Devel::FastProf is a perl per-line profiler. What that means is that it can tell you how much time is spent on every line of a perl script (the standard Devel::DProf is a per-subroutine profiler). I have been the maintainer of Devel::SmallProf for some time and although I found it much more useful that Devel::DProf, it had an important limitation: it was terribly slow, around 50 times slower than the profiled script being run out of the profiler.
- Devel::NYTProf - http://search.cpan.org/~timb/Devel-NYTProf-2.07/lib/Devel/NYTProf.pm
-
名前だけは知ってましたが、これも使ったことがありません。ちょっと前に TokuLog で詳解されていました。ソースコードビューワつきプロファイラとのことです。Devel::FastProf をベースに Perl 好きな New York Times 社が開発したモジュールとのことです。
Devel::NYTProf - Powerful feature-rich perl source code profiler NYTProf stands for 'New York Times Profiler'. Indeed, this module was initially developed from Devel::FastProf by The New York Times Co. to help our developers quickly identify bottlenecks in large Perl applications. The NY Times loves Perl and we hope the community will benefit from our work as much as we have from theirs.
- ※※※※※※※※ ↑↑ここまでのは知っておいた方が良いと思うやつ↑↑ ※※※※※※※※
- Devel::GraphVizProf - http://search.cpan.org/~lbrocard/GraphViz-2.03/lib/Devel/GraphVizProf.pm
-
Devel::SmallProf の解析家結果をグラフ化して解析結果をだすヤツ?これも初めて知りました。使ったことがないのでわかりません。
This module is a hack of Devel::SmallProf by Ted Ashton. It has been modified by Leon Brocard to produce output for GraphViz, but otherwise the only thing I have done is change the name. I hope to get my patches put into the main Devel::SmallProf code eventually, or alternatively read the output of Devel::SmallProf. Anyway, the normal documentation, which you can probably ignore, follows.
- Devel::WxProf - http://search.cpan.org/~mkutter/Devel-WxProf-0.0.1/lib/Devel/WxProf.pm
-
使ったことがありません。これも初めて知りました。Based on Devel::DProfLB by Jeff Weisberg と記述があることから Devel::DProf 系列かと。install エラーがでたので試してもいません。
I wrote Devel::WxProf because I needed a fine-grained one-shot profiler (and because I saw that cool treemap in kcachegrind). I actually wrote it for myself. I'd be pleased if you find it useful, but I probably won't put much time into bugfixes. Send me a test and a patch if you want to speed things up. If you're really out for boosting development, I'll set up a repository I can open up...
サンプルプログラムにおける Perl プロファイラの出力例
サンプルプログラムとして Google AJAX Search API でサイト内検索をするものを用意しました。非常に簡単なモノですがイメージは掴んで頂けるかと。
use Google::Search;
use Encode;
use utf8;

my $site   = 'http://www.drk7.jp/';
my $search = Google::Search->Web(q => "oracle site:$site");
my $result = $search->first;
while ($result) {
    print $result->number, " ", $result->uri, "\n";
    $result = $result->next;
}
Devel::DProf によるプロファイル解析。なぜだか JSON::XS 部分でエラーがでてしまうが深追いせず。
perl -d:DProf tt.pl
dprofpp
Can't call method "JSON::XS" on an undefined value at /usr/local/lib/perl5/site_perl/5.8.7/Google/Search/Response.pm line 7.
Compilation failed in require at /usr/local/lib/perl5/site_perl/5.8.7/Google/Search/Response.pm line 7.
BEGIN failed--compilation aborted at /usr/local/lib/perl5/site_perl/5.8.7/Google/Search/Response.pm line 7.
Compilation failed in require at /usr/local/lib/perl5/site_perl/5.8.7/Google/Search.pm line 62.
BEGIN failed--compilation aborted at /usr/local/lib/perl5/site_perl/5.8.7/Google/Search.pm line 62.
Compilation failed in require at tt.pl line 1.
BEGIN failed--compilation aborted at tt.pl line 1.
Devel::Profiler によるプロファイル解析。JSON::PP 周りで性能劣化していることがわかる。
perl -MDevel::Profiler tt.pl
dprofpp
Total Elapsed Time = 9.667928 Seconds
  User+System Time = 4.841928 Seconds
Exclusive Times
%Time ExclSec CumulS #Calls sec/call Csec/c  Name
 25.5   1.238  2.983   1489   0.0008 0.0020  JSON::PP::string
 20.4   0.991  0.991  52202   0.0000 0.0000  JSON::PP::next_chr
 16.2   0.785  0.785  39387   0.0000 0.0000  JSON::PP::is_valid_utf8
 3.24   0.157  0.468   1340   0.0001 0.0003  Class::MOP::Attribute::get_value
 2.83   0.137  0.262   2599   0.0001 0.0001  Class::MOP::Class::construct_class_instance
 2.83   0.137  0.411   2599   0.0001 0.0002  Class::MOP::Class::initialize
 1.84   0.089  0.089   4004   0.0000 0.0000  JSON::PP::white
 1.80   0.087  0.087   2599   0.0000 0.0000  Class::MOP::does_metaclass_exist
 1.63   0.079  3.233    226   0.0004 0.0143  JSON::PP::object
 1.43   0.069  0.069   2899   0.0000 0.0000  Class::MOP::Attribute::name
 1.43   0.069  0.137     16   0.0043 0.0086  LWP::UserAgent::send_request
 1.20   0.058  0.058   2700   0.0000 0.0000  Class::MOP::Class::get_attribute_map
 1.20   0.058  0.058   1819   0.0000 0.0000  Class::MOP::Class::__ANON__::SERIAL::1::get_meta_instance
 0.99   0.048  0.607    720   0.0001 0.0008  Moose::Meta::Attribute::initialize_instance_slot
 0.87   0.042  0.100   2160   0.0000 0.0000  Class::MOP::Class::get_attribute
[apache@srv01 test]$
Devel::SmallProf によるプロファイル解析。正直かなり見づらい。
perl -d:SmallProf tt.pl
           ================ SmallProf version 2.02 ================
         Profile of (eval 160)[/usr/local/lib/perl5/site_perl/5.8.7/Mo Page 1
       =================================================================
・・・略・・・
    count wall tm  cpu time line
        0   0.00000   0.00000     1:The code for (eval
        1   0.00000   0.00000     2:174)[/usr/local/lib/perl5/site_perl/5.8.7/Moo
        1   0.00000   0.00000     3:se/Meta/Method/Constructor.pm:89] is not in
        0   0.00000   0.00000     4:the symbol table.
        1   0.00001   0.00000     5:
        1   0.00002   0.00000     6:
・・・略・・・
Devel::FastProf によるプロファイル解析。Devel::Profiler であたりをつけた後に見るのが吉。
perl -d:FastProf tt.pl
fprofpp -t 20
/usr/local/lib/perl5/site_perl/5.8.7/LWP/Protocol/http.pm:399 4.74429 34: my $nfound = select($fbits, undef, undef, $timeout);
/usr/local/lib/perl5/site_perl/5.8.7/JSON/PP.pm:734 0.19706 52186: $ch = substr($text, $at++, 1);
/usr/local/lib/perl5/5.8.7/x86_64-linux-thread-multi/IO/Select.pm:116 0.19344 16: defined($w) && (select(undef,$w,undef,$timeout) > 0)
/usr/local/lib/perl5/site_perl/5.8.7/JSON/PP.pm:1169 0.17843 39387: return 1 if (length ($is_valid_utf8 .= $_[0] ) < $utf8_len); # continued
/usr/local/lib/perl5/site_perl/5.8.7/JSON/PP.pm:733 0.15212 52202: return $ch = undef if($at >= $len);
/usr/local/lib/perl5/site_perl/5.8.7/JSON/PP.pm:1171 0.14952 30742: return ( $is_valid_utf8 =~ s/^(?:
/usr/local/lib/perl5/site_perl/5.8.7/JSON/PP.pm:761 0.14107 42113: if((!$singlequote and $ch eq '"') or ($singlequote and $ch eq $boundChar)){
/usr/local/lib/perl5/site_perl/5.8.7/JSON/PP.pm:836 0.12771 39387: $s .= $ch;
/usr/local/lib/perl5/site_perl/5.8.7/JSON/PP.pm:830 0.12507 39387: if ($ch =~ /[\x00-\x1f\x22\x5c]/)  { # '/' ok
/usr/local/lib/perl5/site_perl/5.8.7/JSON/PP.pm:823 0.12464 39387: if( !is_valid_utf8($ch) ) {
/usr/local/lib/perl5/site_perl/5.8.7/JSON/PP.pm:822 0.11614 39387: if ($utf8) {
/usr/local/lib/perl5/site_perl/5.8.7/JSON/PP.pm:1158 0.11612 39387: unless ( $utf8_len ) {
/usr/local/lib/perl5/site_perl/5.8.7/JSON/PP.pm:829 0.11552 39387: if (!$loose) {
/usr/local/lib/perl5/site_perl/5.8.7/JSON/PP.pm:1167 0.11445 39387: return !($utf8_len = 1) unless ( $utf8_len );
/usr/local/lib/perl5/site_perl/5.8.7/JSON/PP.pm:1159 0.11105 30742: $utf8_len = $_[0] =~ /[\x00-\x7F]/  ? 1
/usr/local/lib/perl5/site_perl/5.8.7/JSON/PP.pm:783 0.01651 4916: $u .= $ch;
/usr/local/lib/perl5/site_perl/5.8.7/JSON/PP.pm:782 0.01631 4916: last OUTER if($ch !~ /[0-9a-fA-F]/);
/usr/local/lib/perl5/site_perl/5.8.7/Class/MOP.pm:31 0.01521 2599: sub get_metaclass_by_name       { $METAS{$_[0]}         }
/usr/local/lib/perl5/site_perl/5.8.7/JSON/PP.pm:781 0.01477 4916: $ch = next_chr();
/usr/local/lib/perl5/site_perl/5.8.7/JSON/PP.pm:846 0.01465 4004: while( defined $ch  ){
Devel::NYTProf によるプロファイル解析。nytprof/index.html を見ることで解析結果レポートを見ることができる。圧倒的情報量を非常に見やすく解析することが可能。
perl -d:NYTProf tt.pl
nytprofhtml

解析結果のレポートはこちらで見ることができます。
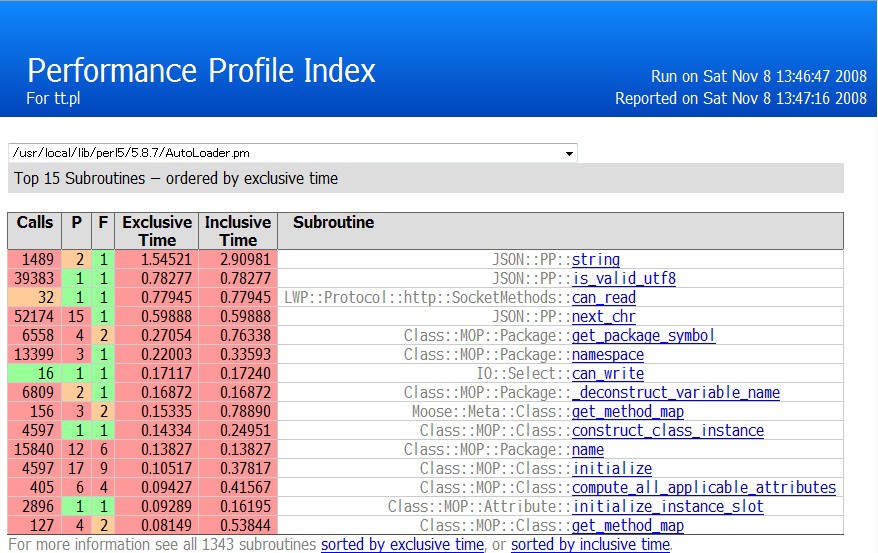
というわけで、僕的なオススメは、Devel::Profiler であたりをつけて、Devel::NYTProf で深追いをするのが良いかと思います。


コメントやシェアをお願いします!